
75 Experiential Marketing Statistics for 2026 (And What They Mean for Your Brand)

Trade show statistics

Experiential marketing stopped being a “nice-to-have” line item years ago. In 2026, it’s one of the few channels where budgets are growing while broader marketing spend stays flat or shrinks — and the data explains why. Live, interactive, and immersive experiences consistently outperform passive advertising on trust, purchase intent, and word-of-mouth, which is exactly why brands keep shifting dollars toward experiential marketing solutions instead of another round of banner ads.

We pulled together 75 of the most relevant, currently cited statistics on experiential marketing, trade shows, gamification, immersive tech, and generational engagement — organized by theme so you can actually use the data, not just skim it. Where it’s useful, we’ve added context on how the numbers show up in real activations, and we’ve linked the flagship stats to their original sources so you can verify them yourself.

1. The Big Picture: Market Size & Growth

  1. The global experiential marketing service market is valued at roughly $55.53 billion in 2026 and is projected to reach $71–73 billion by 2035 (Cvent).
  2. Global experiential marketing spend hit a record $128.35 billion in 2024, surpassing pre-pandemic levels for the first time.
  3. B2C companies spent an estimated $90.3 billion on experiential marketing in 2024 — a 10.3% increase from 2023 (RevenueMemo).
  4. B2B companies spent an estimated $38 billion on experiential marketing in 2024, up 11% year-over-year.
  5. The broader global events industry is projected to reach $2.33 trillion in market size in 2026 (Wave Connect).
  6. The B2B-focused event marketing segment specifically is projected to hit $36.31 billion.
  7. The U.S. B2B trade show market brought in $15.8 billion in 2024 and is on track to reach $17.3 billion by 2028(Trade Show Labs).
  8. North America holds nearly 40% of global experiential marketing share, followed by Europe at 30% and Asia-Pacific at 23%.

What it means: Experiential isn’t a niche tactic anymore — it’s a multi-hundred-billion-dollar category growing faster than traditional media buys, and B2B is actually growing spend slightly faster than B2C.

2. Consumer Behavior & Purchase Intent

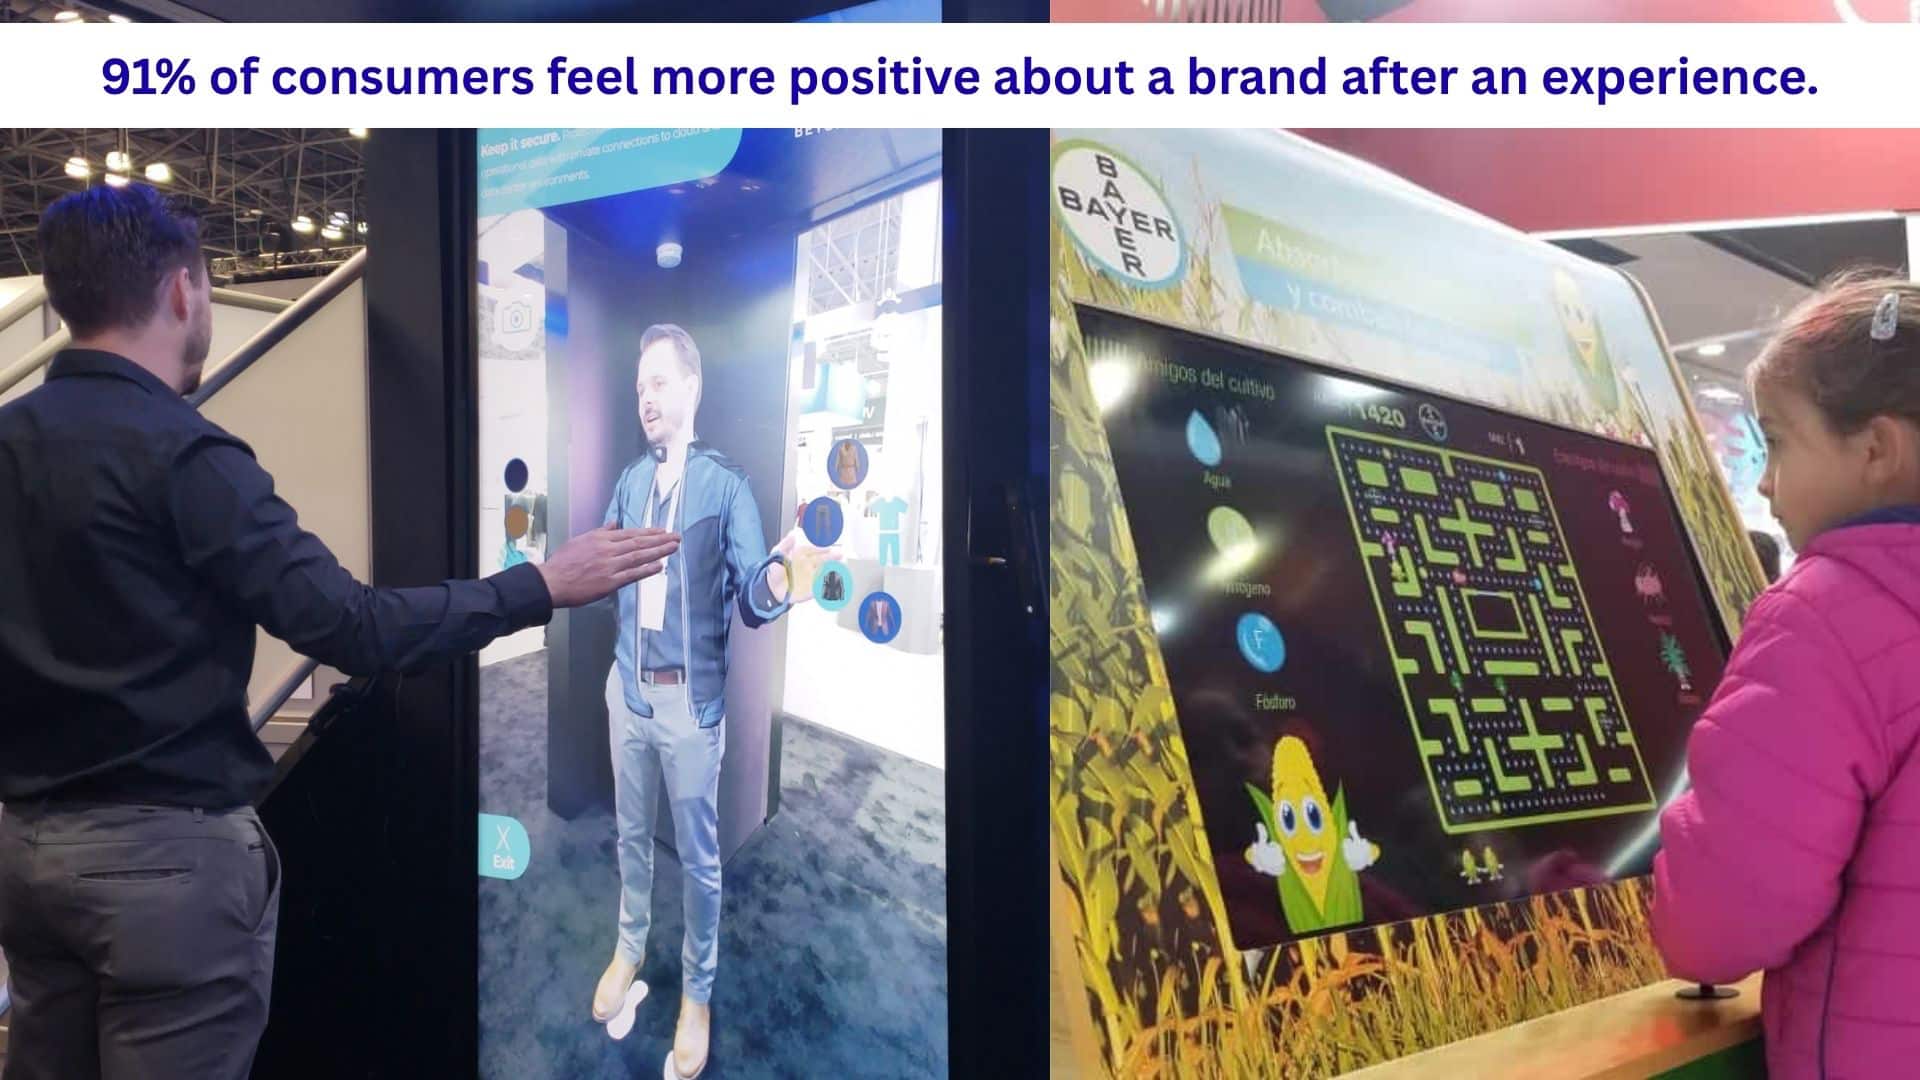
  1. 91% of consumers say they have more positive feelings about a brand after attending an event or experience (Gitnux).
  2. 85% of consumers are more likely to purchase a product or service after attending a live marketing event.
  3. 74% of consumers say engaging with branded event experiences makes them more likely to buy the product being promoted.
  4. 93% of consumers say live events and experiences are more effective than TV commercials at building brand connection.
  5. 72% of millennials say they prefer experiential marketing to traditional advertising.
  6. 70% of attendees become repeat customers after participating in an experiential event (Seeker).
  7. Brands that use experiential marketing generate roughly 3x more word-of-mouth awareness than brands that don’t.
  8. 80% of customers now consider the experience a company provides to be just as important as its actual products or services.
  9. 75% of participants report feeling more connected to a brand after an in-person experiential event.
  10. 92% of consumers prefer in-person events over virtual ones when the event is within an hour’s travel.


What it means: People aren’t just tolerating brand experiences — they’re actively converting because of them, and the halo effect (positive sentiment, repeat purchase, word-of-mouth) sticks around well after the event ends.

3. Budgets & Investment Trends

  1. 84% of consumer marketers and 86% of B2B marketers plan to increase event spending in 2026 (Derse / EventTrack 2026).
  2. Event budgets are growing +10.9% even as overall B2B marketing spend declines.
  3. 51% of brands plan to increase experiential marketing investment through 2026.
  4. 74% of Fortune 1000 marketers plan to increase their experiential marketing budgets.
  5. 80% of companies have increased experiential budgets, which now represent 10–30% of total marketing spend.
  6. 33% of B2B marketers name events and experiential marketing among their top three areas for increased spending in 2026.
  7. 78% of B2B marketers allocate budget to experiential marketing, but fewer than 1 in 3 call their program “established” or “advanced.”
  8. 40% of B2B marketers still allocate just 1–10% of total marketing spend to experiential.

What it means: Budget growth is outpacing program maturity — a lot of teams are getting more money to spend on experiential before they’ve built a mature strategy for it, which is exactly where a proven activation partner earns its keep.

4. ROI & Measurement

    1. Average ROI on well-run experiential campaigns falls between 3:1 and 5:1.
    2. 48% of brands report ROI in that 3:1–5:1 range on their experiential campaigns.
    3. Experiential campaigns show conversion rates roughly 10% higher than comparable digital-only campaigns.
    4. Only 23% of marketers feel confident measuring the emotional impact of a live brand activation.
    5. 52% of business leaders say events deliver the greatest ROI of any marketing channel they run.
    6. Trade shows deliver an average of $20.98 for every $1 spent (Wave Connect).
    7. 70% of B2B marketers measure experiential impact primarily through engagement metrics like attendance and participation.

If proving ROI is your biggest internal hurdle, our trade show ROI calculator is built to help you turn booth traffic and lead data into a number leadership actually cares about.

5. Trade Shows & B2B Lead Generation

    1. 81% of trade show attendees come with actual buying authority (Dreamcast).
    2. Average cost per lead at a trade show is $112, compared with $259 for a field sales call and $332 for telemarketing.
    3. Meeting a prospect at a trade show costs about $142, versus $259 to meet them at their office.
    4. 72% of B2B buyers still prefer meeting vendors in person over any digital alternative.
    5. 76% of trade show booth visitors are not currently doing business with the exhibitor — trade shows function as an acquisition channel, not just a relationship-maintenance one (PureXhibits).
    6. Only 49% of leads get a follow-up within five days of the show closing.
    7. 94% of marketers believe their own company fails to convert event leads into real sales opportunities.
    8. 59% of attendees make a purchase decision within three months of attending a trade show.
    9. Booths that use games or competitive elements see meaningfully higher dwell time and more leads captured per hour than passive displays.
    10. 87% of attendees say interactive displays significantly impact their engagement level at a trade show.

The pattern here is consistent: trade shows still generate cheap, high-intent leads, but most companies leak value in the follow-up. If lead capture and conversion are the weak link, our guide to trade show lead generation walks through the pre-show, on-floor, and post-show tactics that close that gap — and pairing a strong follow-up process with genuinely engaging trade show booth game ideas is one of the more reliable ways to boost both dwell time and lead quality at once.

6. Gamification & Interactive Engagement

    1. Gamified campaigns produce engagement rates 100–150% higher than traditional marketing approaches (AmplifAI).
    2. Gamified content gets shared roughly 12x more than non-gamified content.
    3. Adding gamification lifts trial usage by 54% and “buy” clicks by 15%.
    4. 85% of consumers say they prefer brands with gamified loyalty programs, which can lift retention by as much as 47%.
    5. The global gamification market is valued between $19–36 billion in 2025–2026 and projected to top $92 billion by 2030.
    6. 70% of Global 2000 companies already use some form of gamification across training, sales, or customer engagement.
    7. Websites with gamification features see a 29% increase in site actions like clicks and shares.
    8. Over 73% of new experiential campaigns in the past year included AR, QR codes, gamification, or a virtual participation element.

This is where the format of the activation itself matters as much as the venue. A branded claw game or custom spin wheelat a booth does exactly what these numbers describe — it turns a passive walk-by into an active, shareable interaction. We’ve seen this play out directly at events like our custom two-player claw machine build at DDW 2026 and in the mechanics behind our giant interactive reaction wall experience. For teams planning a conference presence specifically, games for conferences breaks down formats that work in that lower-key, higher-intent environment.

7. AR, VR & Immersive Technology

  1. 87% of marketers plan to use virtual reality in future experiential campaigns (Cvent).
  2. 75% of global brands are expected to adopt some form of AR or VR marketing by 2026 (PatentPC).
  3. Worldwide AR/VR user penetration is projected to reach 54.9% in 2026 (Statista).
  4. The global immersive technologies market is projected to reach $493.5 billion by 2026.
  5. The immersive marketing segment within experiential (events specifically) is growing at a 28.6% CAGR from 2024 to 2030.
  6. 87% of event attendees share their experience on Instagram, making it the single most-used platform for experiential content.
  7. Early adopters using AR try-on experiences report 30–50% lifts in conversion rate.
  8. Hologram and immersive-tech activations have been shown to roughly double engagement compared with static, non-interactive displays.

An augmented reality mirror, a round of virtual reality trivia, or a 360 photo & video experience all tap directly into this trend — and because attendees are already primed to share AR/VR moments on social, these formats tend to extend a booth’s reach well past the people who actually attended.

8. Social Sharing, UGC & Amplification

    1. 98% of attendees create some form of social content during a brand activation.
    2. Emotionally connected customers are worth more than twice as much in lifetime value as merely “satisfied” ones.
    3. 87% of global consumers now agree that the best brand experiences leave them feeling genuinely changed, not just entertained (VML Future 100).
    4. 64% of attendees say they prefer immersive, hands-on experiences over app-based or purely digital elements at live events.
    5. Gen Z trusts content from peers 4.3x more than content created directly by brands.
    6. Micro- and nano-influencer partnerships now outperform celebrity-led activations, with a reported 3.2x preferenceamong younger audiences.
    7. Nearly 80% of Gen Z and millennials now factor social media directly into their shopping journey, often starting with something they saw at — or shared from — a live event.

A custom photo booth or green screen video experience is one of the simplest ways to manufacture this shareable moment on purpose. The content people generate during an activation frequently outperforms the paid media budget behind it.

9. Generational & Workforce Engagement Trends

    1. Gen Z spends about 1.4 hours a day on social media — more time than they spend streaming TV and movies combined (Hootsuite).
    2. Gen Z’s global spending power is projected to reach $12 trillion by 2030.
    3. 78% of millennials say they’d rather spend money on a brand experience than buy a product through another channel.
    4. 90% of employees say gamification makes them more productive at work — a stat that translates directly to internal events, incentive programs, and team activations.
    5. Companies with highly engaged employees are 22% more profitable and 21% more productive than those without.
    6. 83% of employees who go through gamified training report feeling motivated, compared with just 39% using traditional training methods.
    7. 78% of job seekers say a company using gamification in its process appears more attractive and forward-thinking.

This isn’t just a consumer-facing trend — internal and team-building activations follow the same psychology. A scavenger hunt team building activity works because it borrows the exact same engagement mechanics that make consumer gamification so effective: friendly competition, clear objectives, and a shareable outcome

10. Sustainability & the Road Ahead

    1. 87% of B2B brands say sustainability is now on their event-planning agenda, with most targeting a more sustainable portfolio within 3–4 years (Derse / EventTrack 2026).
    2. Exhibitors using modular, reusable booth structures are saving roughly 20% on carbon footprint and cost year over year compared with disposable builds.

What it means: Sustainability is shifting from a “nice extra” to a stated planning requirement, especially for B2B brands answering to procurement and ESG teams.

The Takeaway

Across all ten categories, the same theme keeps showing up: experiential marketing wins on trust, memory, and conversion in ways passive advertising simply can’t match — but only when the execution matches the ambition. Interactive formats, immersive tech, and genuine gamification aren’t decoration; they’re the mechanism behind almost every strong number in this list.

If you’re building your 2026 activation calendar, our branded games hub is a good next stop for format ideas, and if you’re weighing a specific vertical strategy — from pharmaceutical experiential marketing engagement strategies to large-scale consumer activations like our reaction game at the Indy 500 or the Bayer Berocca motion-capture launch — we’d be glad to help you translate these numbers into your own event floor.